Part 1: Adding the Timeline Visualization
Why a Timeline?
One important metric when delivering user desktops is the amount of time the user has to wait for the desktop to launch. It’s hard to ensure user acceptance of the delivered environment if they find it slow before their desktop even becomes available. Various processes run to build up the user environment from many configuration layers, including group policies retrieved from busy domain controllers, policies from desktop delivery software like Citrix, and policies from user experience management software like Ivanti or RES.
The Splunk Template for XenDesktop helps you monitor user logon performance data with a dashboard that reports which components contributed to the logon process and how long some of them took to run. You can see this dashboard by going to the “Users” menu, then down to “User Experience,” then down to “User Experience – Logon Performance.” On this page, you can enter a time period and a user ID to search for a user’s sessions. A list of sessions is returned so that you can click on a session and drill down to the detailed “User Experience - Logon Performance” dashboard for that particular session.
At the top of the dashboard, the username and session ID you selected has been filled in for you and detailed statistics of the logon process are presented:
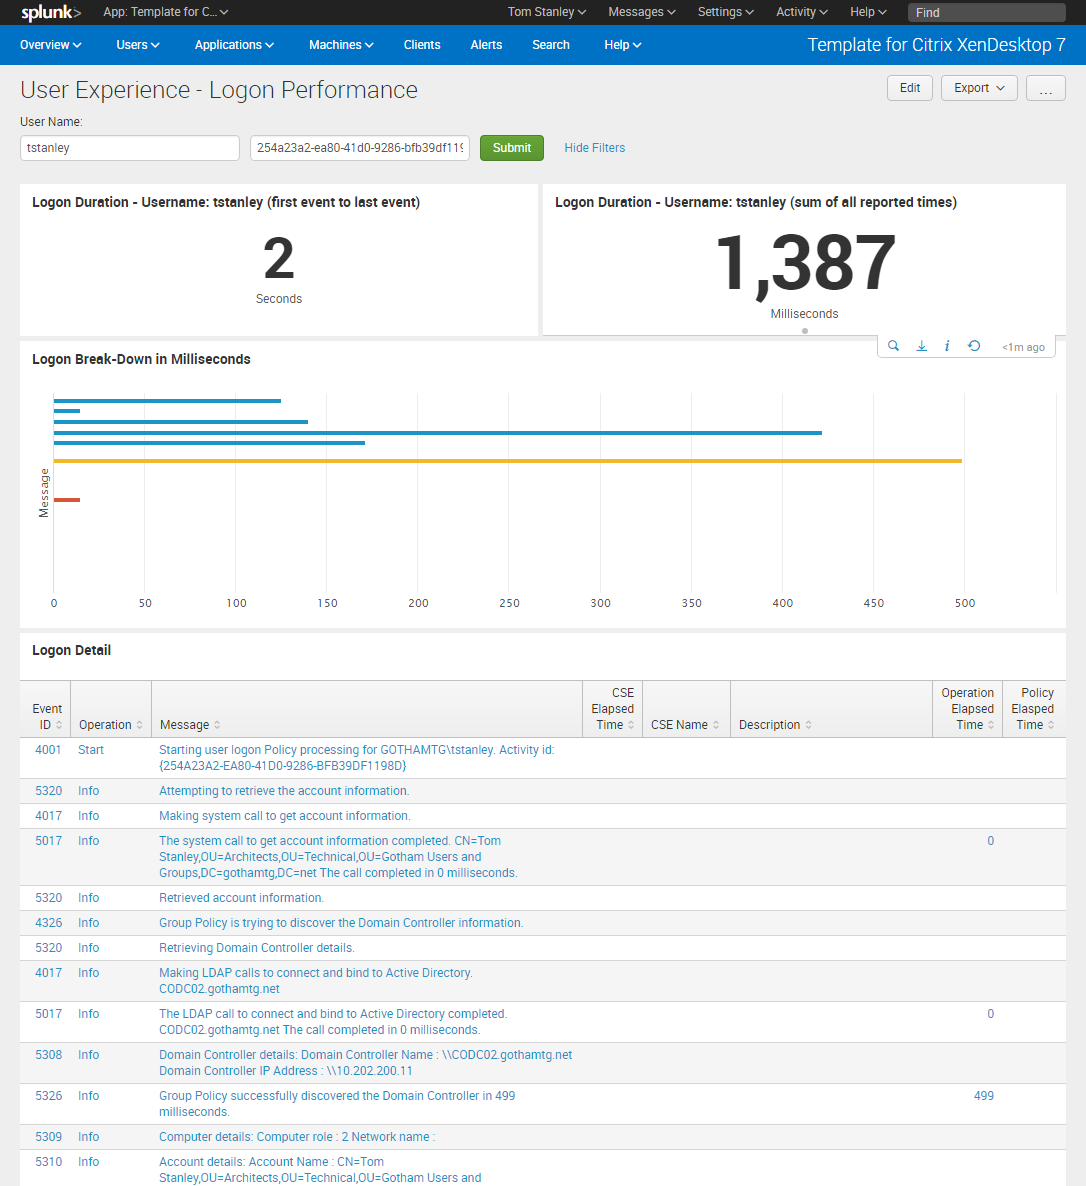
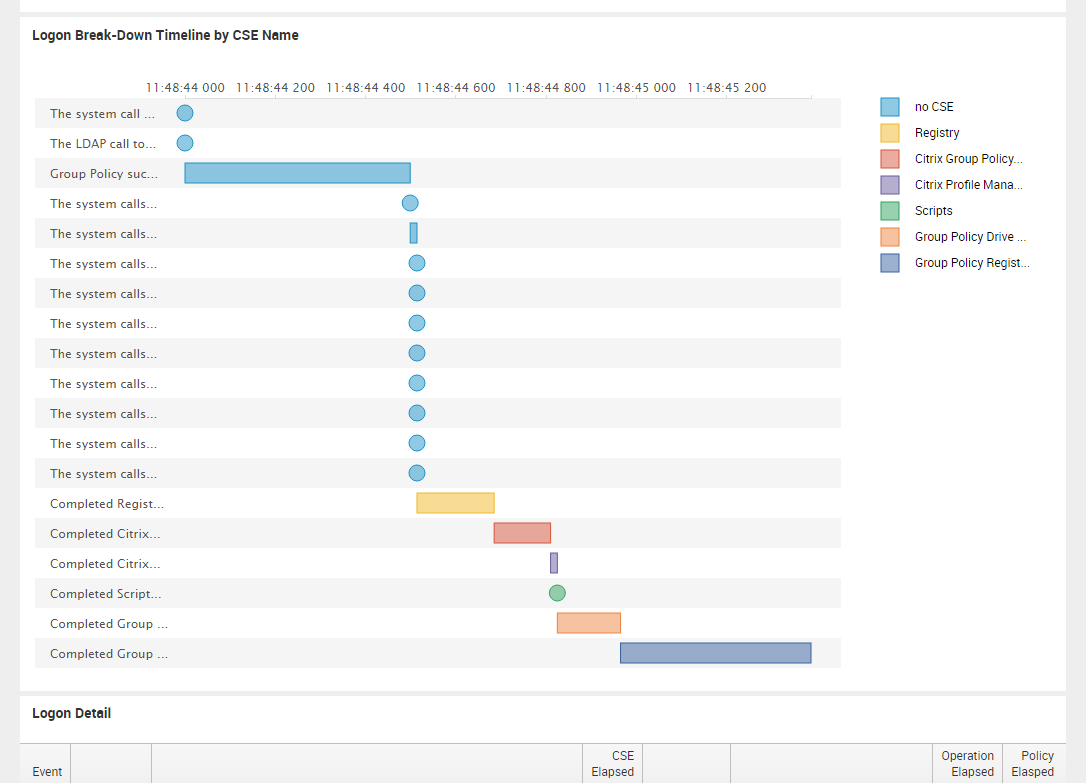
The information is here, but it’s hard get an overall view of what happened. You can tell what task took the longest in the “Logon Break-Down in Milliseconds” bar graph and you can tell the sequence of tasks and the time taken in the “Logon Detail” table, but it would be nice to see just the tasks that reported a duration in a graphical timeline. Something like this:
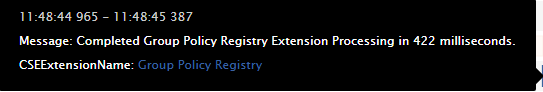
If you hover over a circle or bar you get a popup with details (bottom bar in this case):
That’s a useful chart, but Splunk can’t do timelines…can it? It can if you know how to add custom visualizations to Splunk and how to manipulate your events to calculate the metrics those visualizations need. In Part 1 you’ll learn how to add a visualization to Splunk, and in Part 2 we’ll use some slightly advanced Search Processing Language commands to extract the right data.
The Visualization
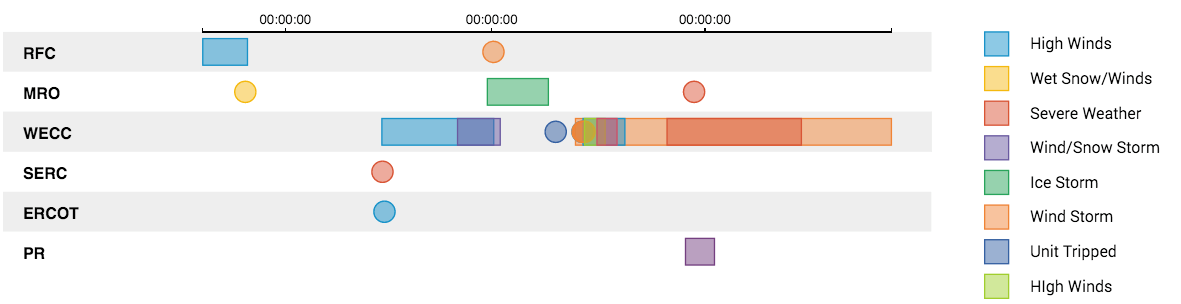
Out-of-the-box, Splunk does not provide a timeline visualization, but that doesn’t mean you can’t add one. Formerly you had to build your dashboard manually using HTML and JavaScript, then incorporate a JavaScript-based timeline package, such as one from d3js.org. Beginning in Splunk Enterprise 6.4, a feature was added allowing developers to build custom visualization packages and distribute them through SplunkBase, just like a Splunk app. Within the Splunk GUI, a user can search SplunkBase for visualizations and click to install them. They become just another choice in the dashboard editor alongside the line, column, and pie charts, etc. One of these visualizations developed by Splunk is “Timeline - Custom Visualization,” which takes times and durations and turns them into a simple Gantt chart like this example:
To install this visualization, go to the “Manage Apps” page in Splunk and click the “Browse More Apps” button at the upper left. In the resulting search interface for SplunkBase, you can check off “Visualizations” in the “App Content” section of the filtering criteria along the left edge. Now enter “timeline” in the search box to find timeline examples, including “Timeline – Custom Visualization.”
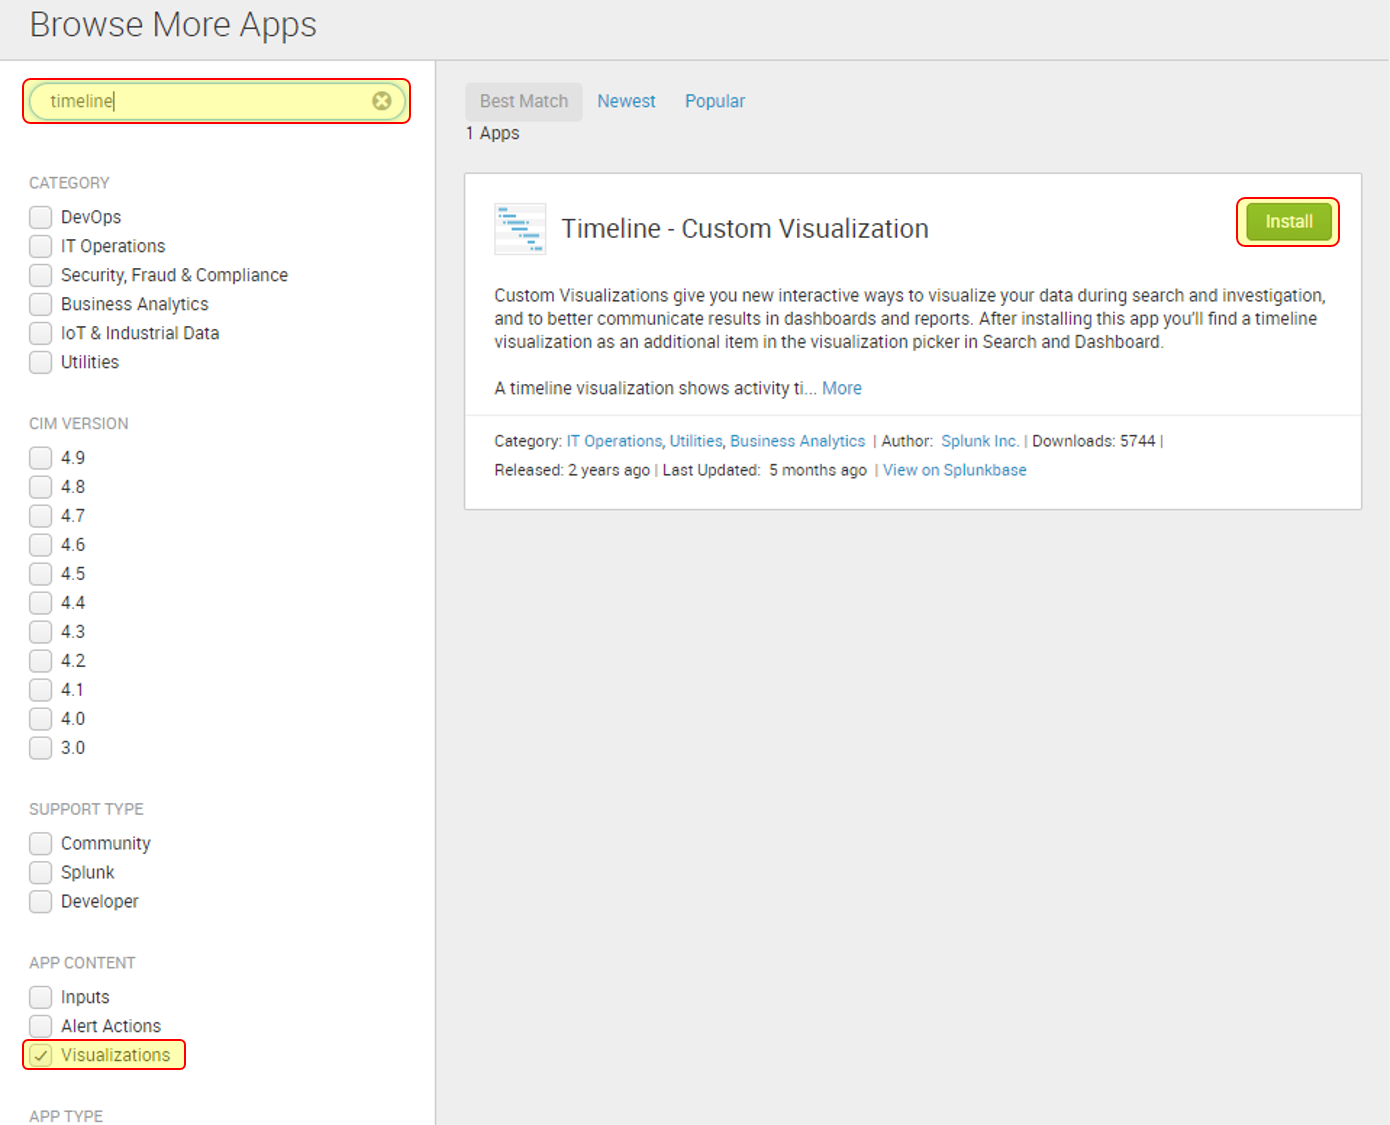
Simply click “Install,” enter your Splunkbase credentials; the visualization will be installed and will be immediately available with the other Splunk visualization choices as shown here:
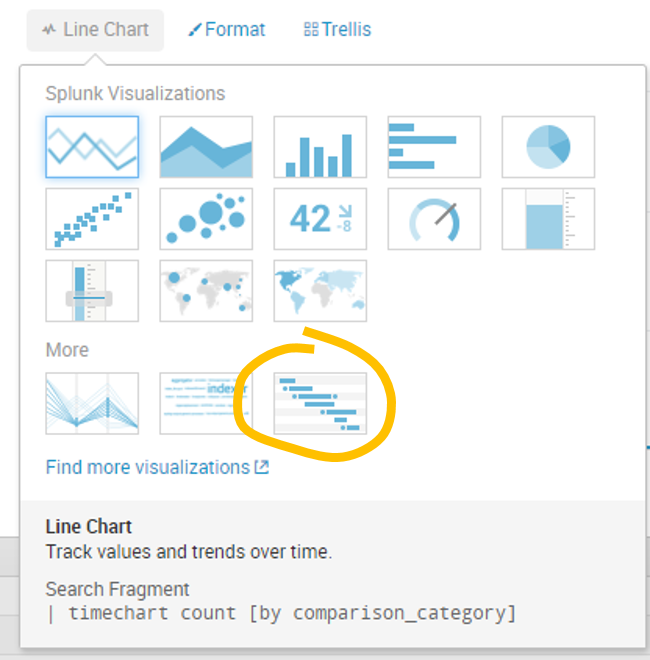
Now that a timeline is a simple selection in any dashboard, the next step is adding one to the XenDesktop dashboard and building the right search. In Part 2, we’ll add the timeline and calculate a precise start time for each event.